Testautomation with Computer Vision and FFT at BMW
Modern vehicles are more than just engines and wheels; they are complex ecosystems of software running on sophisticated hardware. At the heart of the user experience is the infotainment system. How can we test the software on it, especially during early development, without interfering with the system itself?
During my time as a working student at BMW, I was tasked with solving this exact problem. We had a fleet of test vehicles that often sat idle over the weekend. This downtime was a wasted opportunity. My project was to transform these parked cars into a 24/7 automated testing farm to hunt for bugs in the infotainment system's boot process.
Testing a Performance-Critical "Early System"
Before the familiar Android-based user interface loads, a foundational "Early System" boots up. This Linux-based system is responsible for providing essential functionalities immediately after the driver enters the vehicle. Due to legal and safety requirements, this system must be incredibly performant and boot within a strict time frame.
This presented our primary constraint: we couldn't run any resource-intensive monitoring agents directly on the device. Any additional process could impact the system's performance, invalidating the very tests we were trying to conduct. We needed a way to observe the system's behavior from the outside—a non-intrusive, "black-box" testing approach.
The bugs we were looking for were varied and often elusive:
- Total failure: The screen remains completely black.
- Performance degradation: The boot process takes longer than the allowed X seconds.
- Glitches: The boot animation stutters, freezes, or restarts.
- Unexpected states: Error messages or other unintended visuals appear.
- Rare, intermittent faults that are difficult to catch with manual testing.
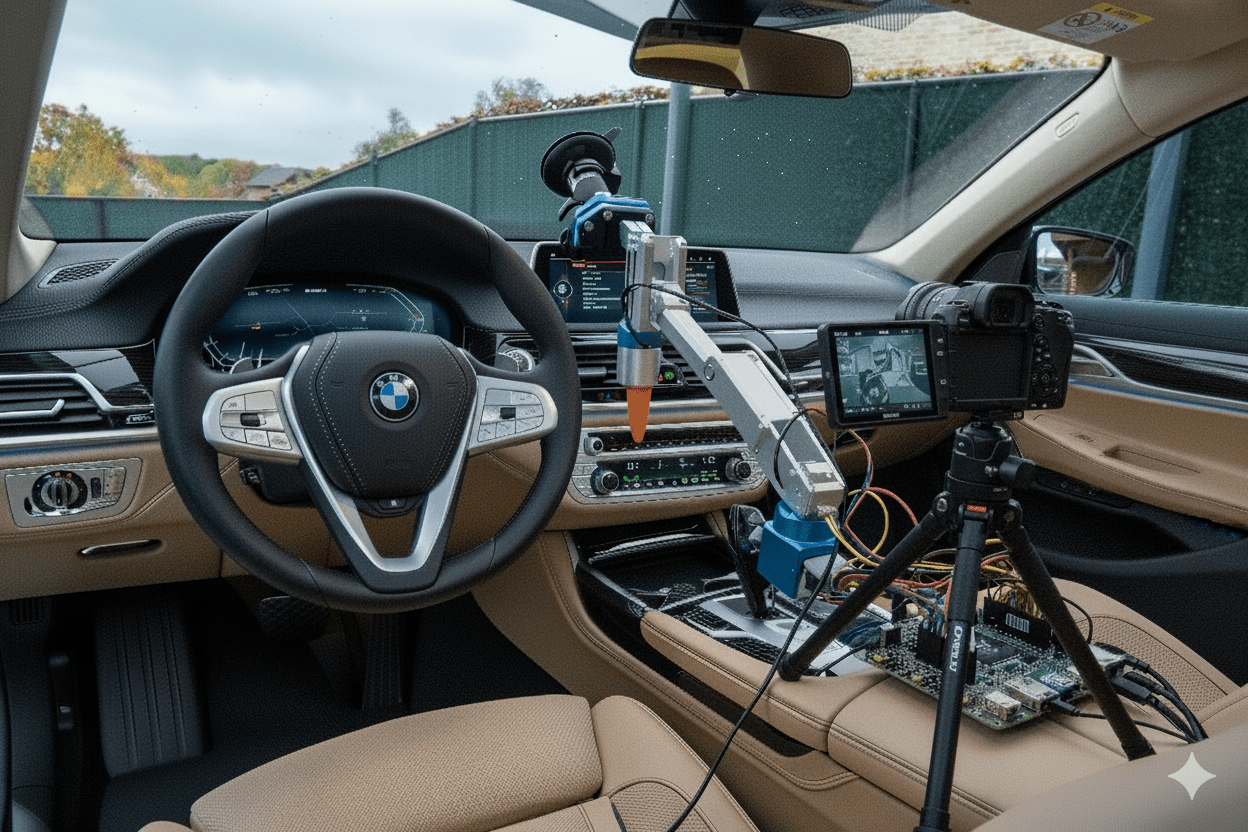
An External Eye with a Brain
To monitor the system externally, we built a mobile testing rig. This setup was designed to be easily moved between different vehicles.
The hardware consisted of:
- A camera setup on a custom 3d printed car mount positioned to film the vehicle's central infotainment screen.
- A Raspberry Pi connected to a relay, which can switch a specific pin in the connector between door and vehiecle. By controlling the relay, the Raspberry Pi could simulate a door-opening event (similar to a user entering the car), which "wakes up" the vehicle and initiates the boot sequence.
The test cycle was simple yet powerful:
- The Raspberry Pi triggers the relay, waking the car.
- The camera starts recording the screen.
- We wait several minutes for the car to complete its boot cycle and eventually go back to sleep.
- The process repeats.
This setup ran autonomously, generating hundreds of video recordings each week. We now had the data to catch even the rarest of bugs. But this created a new problem: a data deluge.
The Bottleneck: From Hundreds of Videos to Actionable Insights
Manually watching hundreds of videos each week was not a scalable solution. We estimated it would require up to 25 hours of manual labor every single week. The process would be tedious, expensive, and prone to human error.
Automation was the only answer. However, the nature of the problem made traditional machine learning approaches difficult. Training a model on "failure states" is nearly impossible because you can't predict all the ways a system can fail.
This led to our core strategy: Instead of identifying every possible error, we would teach our system to recognize the single, "golden" signature of a successful boot. Any deviation from this perfect state would be flagged as an anomaly and then manually checked.
A Pipeline from Pixels to Patterns
To implement this, I developed a multi-stage computer vision and signal processing pipeline.
1. Screen Detection with YOLO
Because our testing rig was mobile, the screen was never in the exact same position in the video frame. The first step was to reliably locate the screen. I trained a custom YOLO (You Only Look Once) object detection model. It processed the several frames of each video to draw a bounding box around the infotainment display, defining our region of interest for the rest of the analysis.
2. Signal Extraction: Normalized Brightness Over Time
With the screen located, we needed a simple metric to represent its state over time. For each frame, the program calculated the average brightness of the pixels within the YOLO-defined bounding box. Crucially, this brightness value was normalized. This step was vital to make the system robust against changing ambient lighting conditions, whether the test was running in a dark garage or in a sunlit hall.
When plotted, the brightness signature of a successful boot looked quite distinct to the human eye:
- Low brightness: The screen is off.
- A gentle rise with fluctuations: The boot animation plays.
- A sharp rise to a high, stable value: The Android UI with its bright widgets has loaded.
- A final animation and drop to low brightness: The system goes back to sleep.
A conceptual representation of the brightness signature for a successful boot sequence.
Pattern Recognition with Fast Fourier Transform (FFT)
How can a computer learn to recognize this specific curve? The answer came from the world of signal processing: the Fast Fourier Transform (FFT).
FFT is a powerful algorithm that decomposes a signal from the time domain (our brightness-over-time graph) into its constituent frequencies in the frequency domain. Think of it like a prism splitting white light into its component colors.
- A successful boot has a smooth, predictable brightness curve. This translates into a very clean frequency spectrum with only a few dominant, low-frequency spikes. It's a simple, pure "tone."
- An error state—like a flickering screen, a restarting animation, or an error message popping up—introduces abrupt, chaotic changes in brightness. This creates a much "noisier" signal, which results in a messy frequency spectrum with many more frequencies and less distinct spikes.
By analyzing the output of the FFT, the program could easily distinguish between the simple signature of a successful boot and the complex, noisy signature of an anomaly. It effectively filtered out irrelevant noise and focused only on the core pattern,
If an anomaly was detected, the system automatically timestamped the moment of failure in the video and, most importantly, saved the corresponding vehicle trace logs from that exact moment. This gave developers the video evidence and the deep system-level data needed to quickly diagnose and fix the bug.
All results were compiled into a clean Excel report, giving a high-level overview of test runs, pass/fail rates, and links to the logs for any detected failures.
Enhancing Interaction: Introducing an Automated Actuator
While observing was crucial, some test scenarios required interaction. For example, if the system entered an error state, we wanted to to press a physical button to attempt recovery or navigate through a menu.
To address this, I later integrated a self-designed 3d printed actuator. It utilized a suction cup to firmly position itself on the windshield, allowing its "finger" to precisely interact with physical buttons or touch-sensitive areas in the car.
This actuator, also controlled by the Raspberry Pi, became an integral part of the testing loop. It allowed us to trigger specific functions like simulating a user pressing "Home" or "Back" buttons and Recovery from error states by pressing the start/stop button.